

9 charts to help you make sense of Canadian real estate craziness in 2017
Wednesday Mar 08th, 2017
9 CHARTS TO HELP YOU MAKE SENSE OF CANADIAN REAL ESTATE CRAZINESS IN 2017
Josh Sherman, BuzzBuzzNews Canada
Economic analysis isn't always the easiest to understand. There's even a word for economists' jargon: Economese.
Thankfully, there are charts. Economists with the country's biggest financial institutions feed the real estate obsessed with innumerable charts presenting complex data in a straightforward way.
Here are 9 interesting examples BuzzBuzzNews has come across over the past year.
1. How downtown Toronto and Vancouver condo prices stack up globally
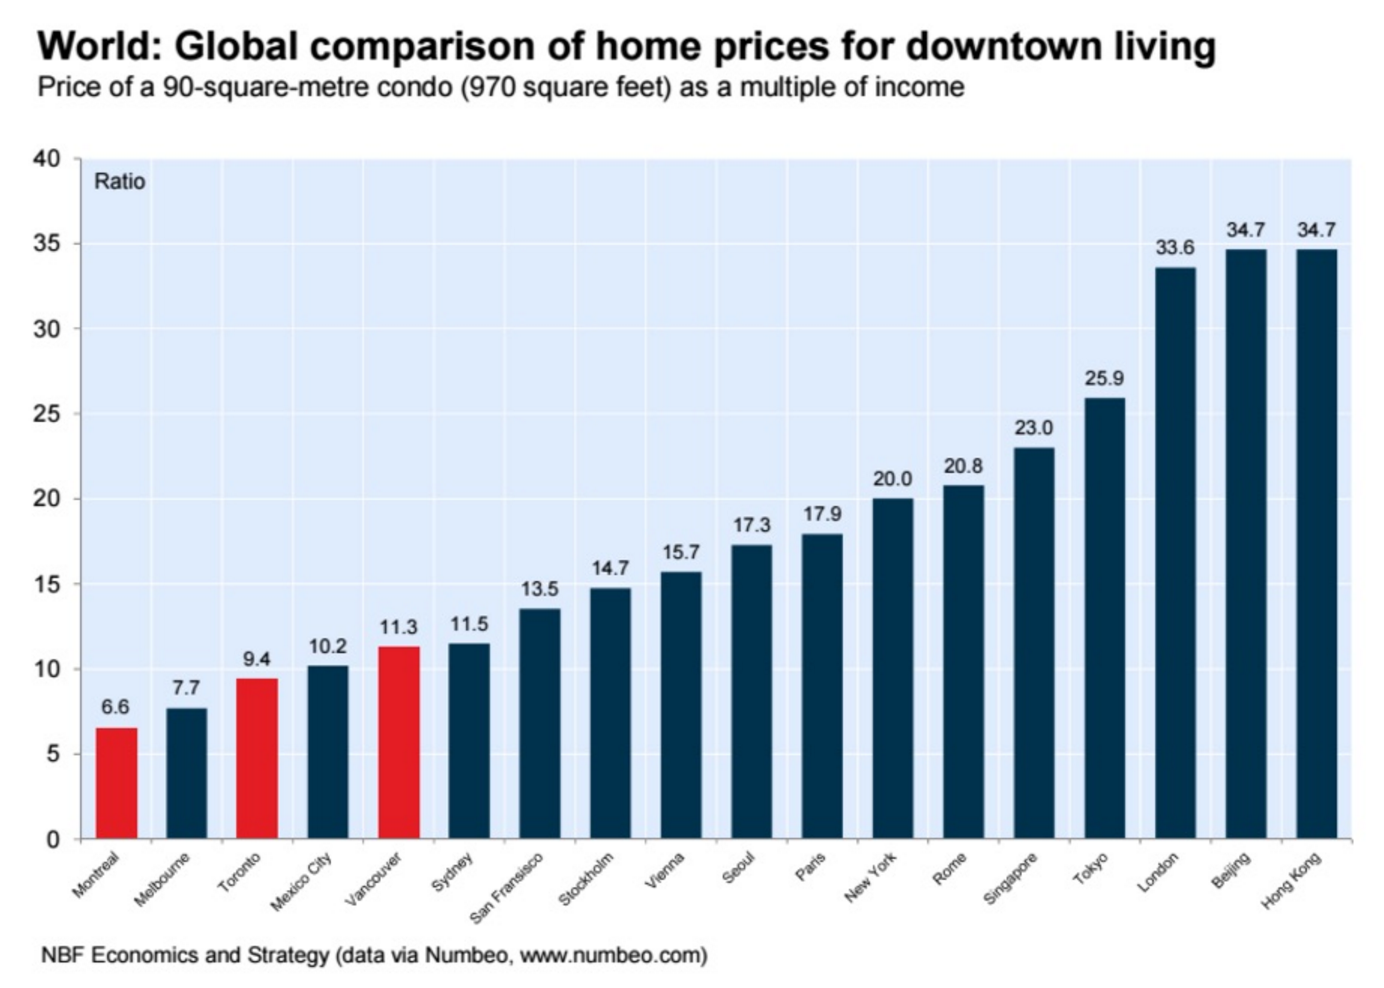
Whats going on here? National Bank gauges affordability by expressing the average cost of a 90-square-metre (970 SF) condo as a multiple of average family incomes in major markets worldwide.
The takeaway: "A comparison of price-to-income multiples of comparable condos in major city centres worldwide shows these two markets [are] still relatively affordable," write National Bank economists Matthieu Arseneau and Kyle Dahms.
2. How much of Canadians earnings are eaten up by mortgage payments
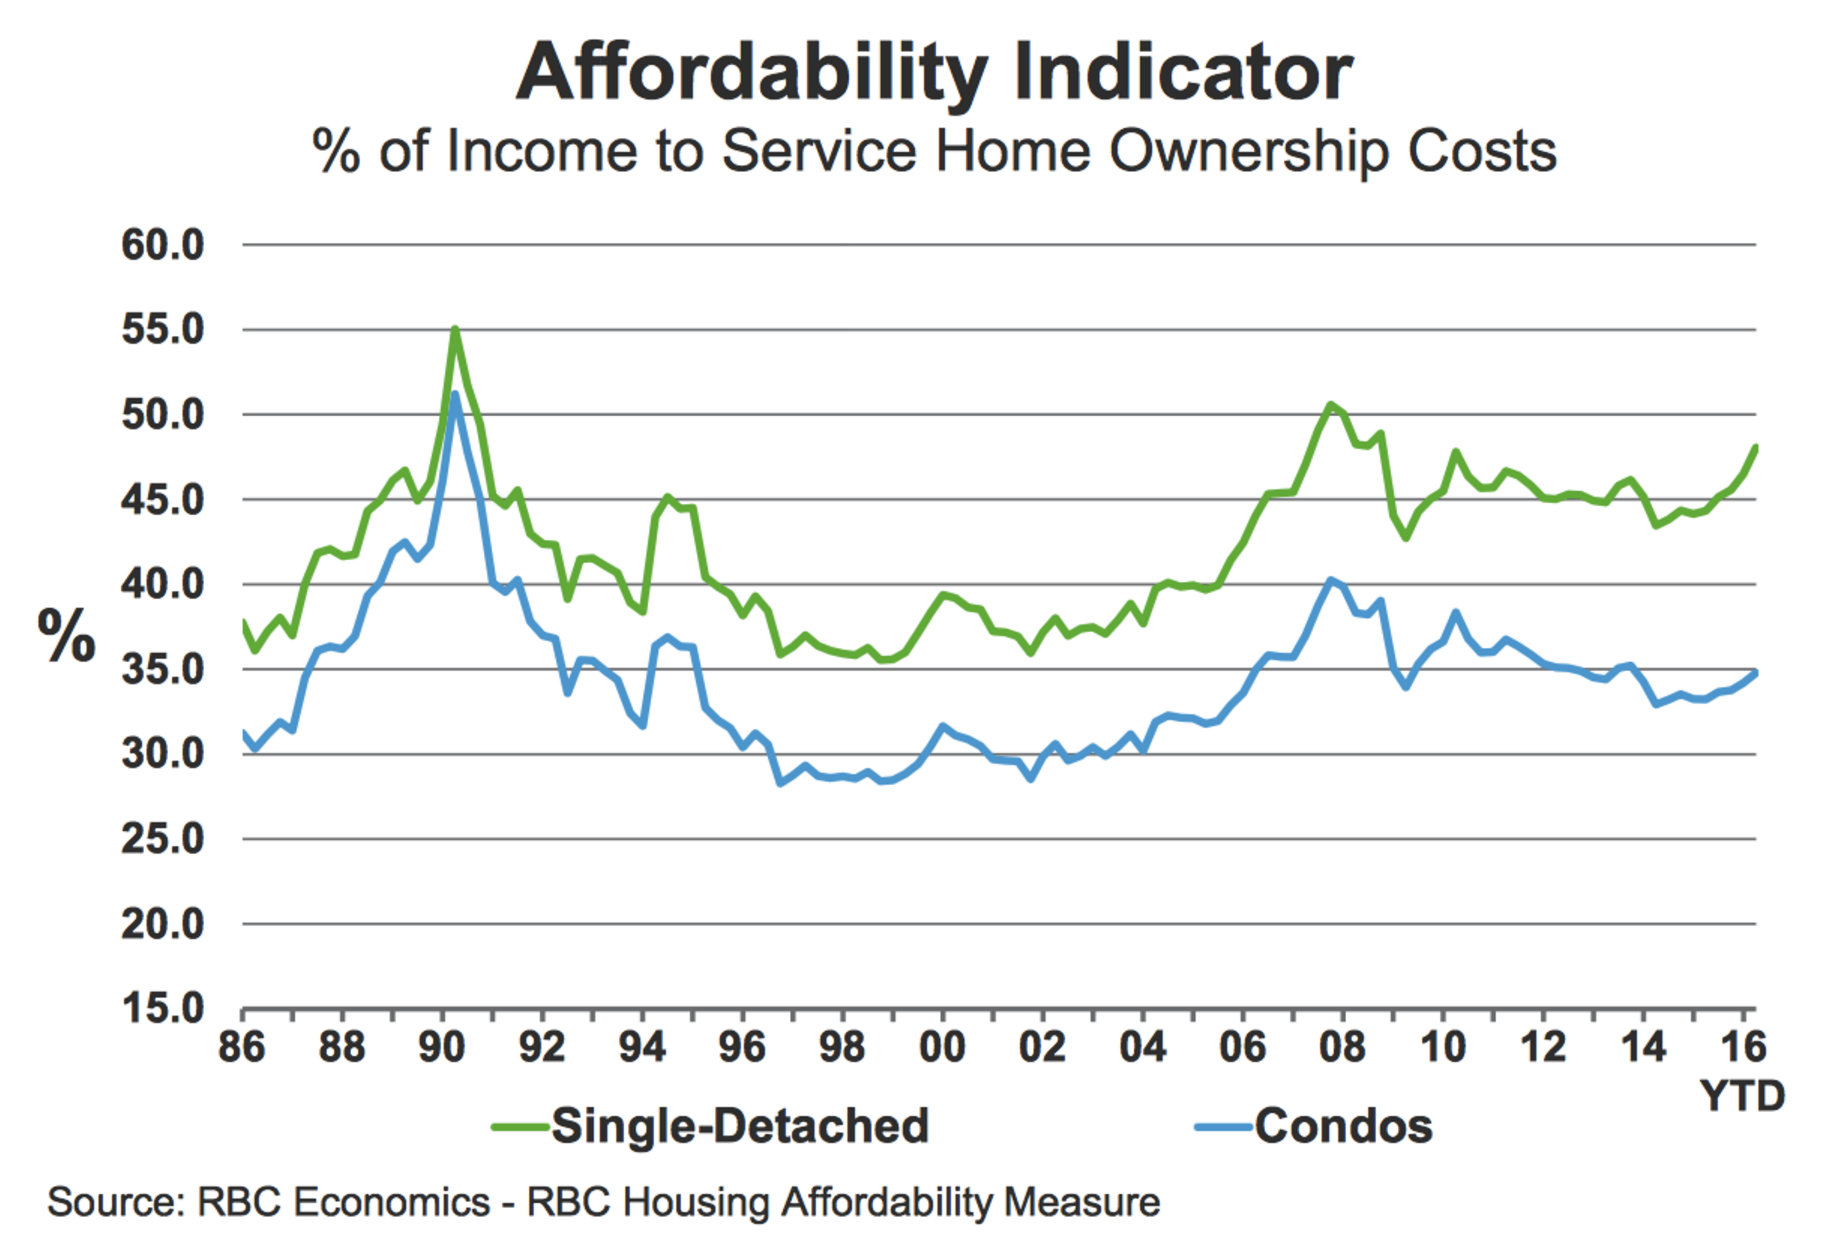
Whats going on here? Looking at affordability another way, Morguard REIT displays what share of a typical Canadian's income has gone towards servicing homeownership costs over the years.
The takeaway: Borrowers may not rejoice when they make their monthly mortgage payments, but just look at how much debt-saddled homeowners shelled out every month at the onset of the '80s (more than half the typical income, thanks to sky-high interest rates).
3. A history of Toronto real estate peaks and crashes
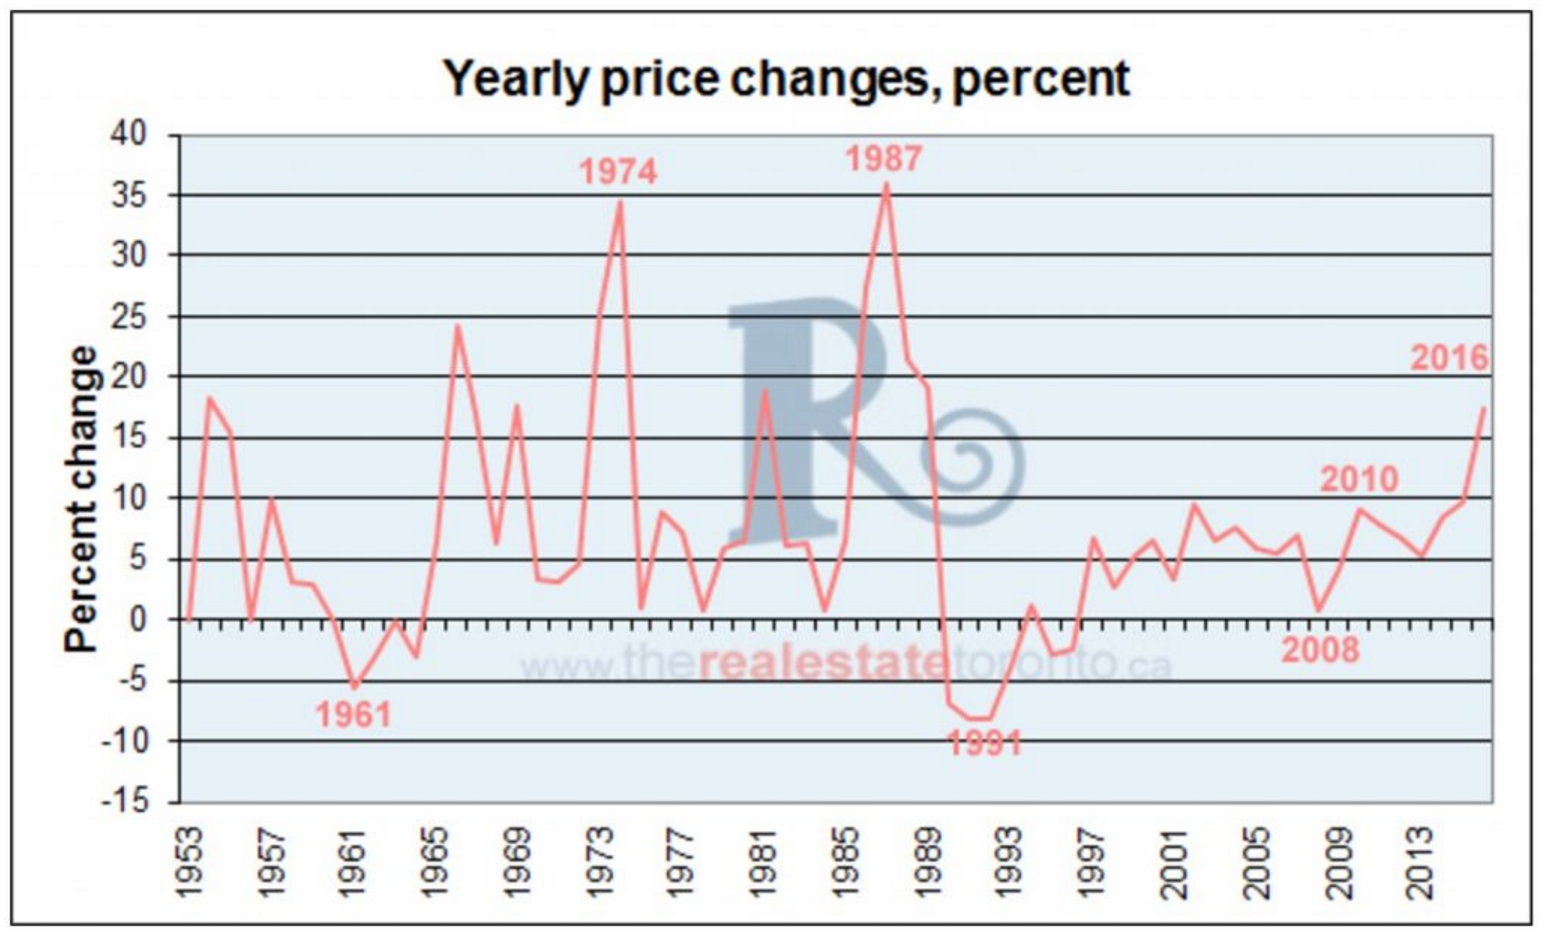
Whats going on here? On an unadjusted basis, Bosley Real Estate expresses annual GTA price gains as a percentage dating back to 1953.
The takeaway: We've been here before. And hey, by at least one measure, Toronto's current housing boom pales in comparison to some previous peaks.
4. One of these booms is not like the others (at least not yet)
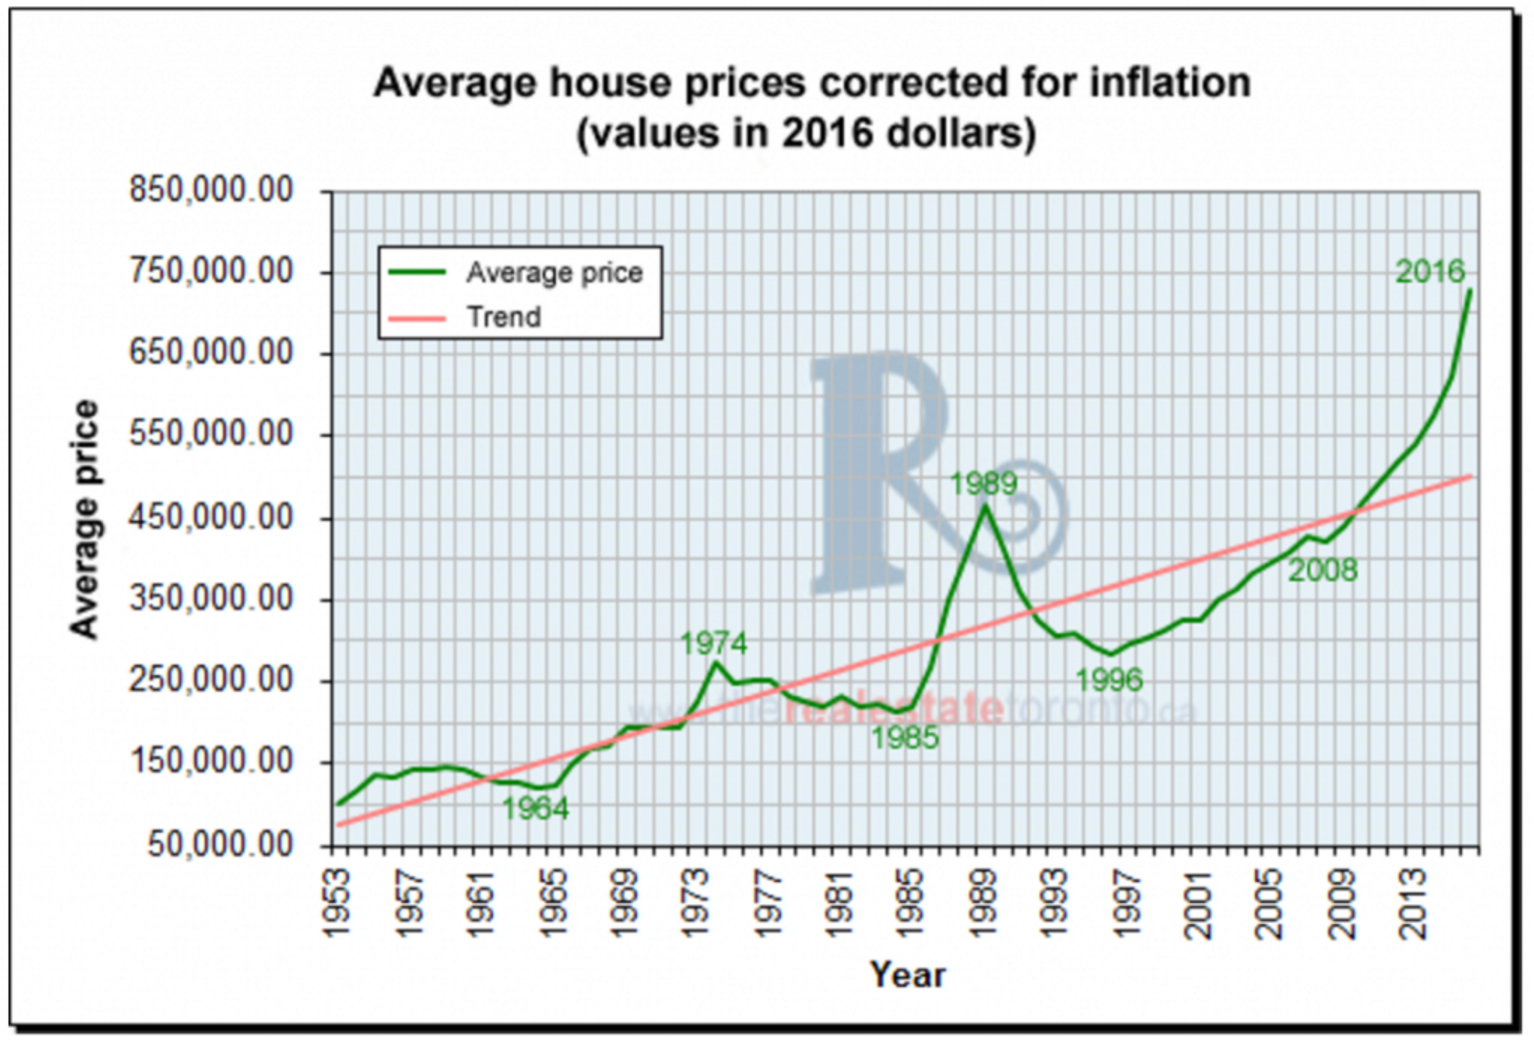
Whats going on here? Bosley also adjusted annual home prices for the GTA over the same period.
The takeaway: A GTA home could be had for $150,000 (in today's dollars) in the '50s, which is likely to rile house hunters today.
5. Canada's housing market hasn't been this tight since before the Great Recession
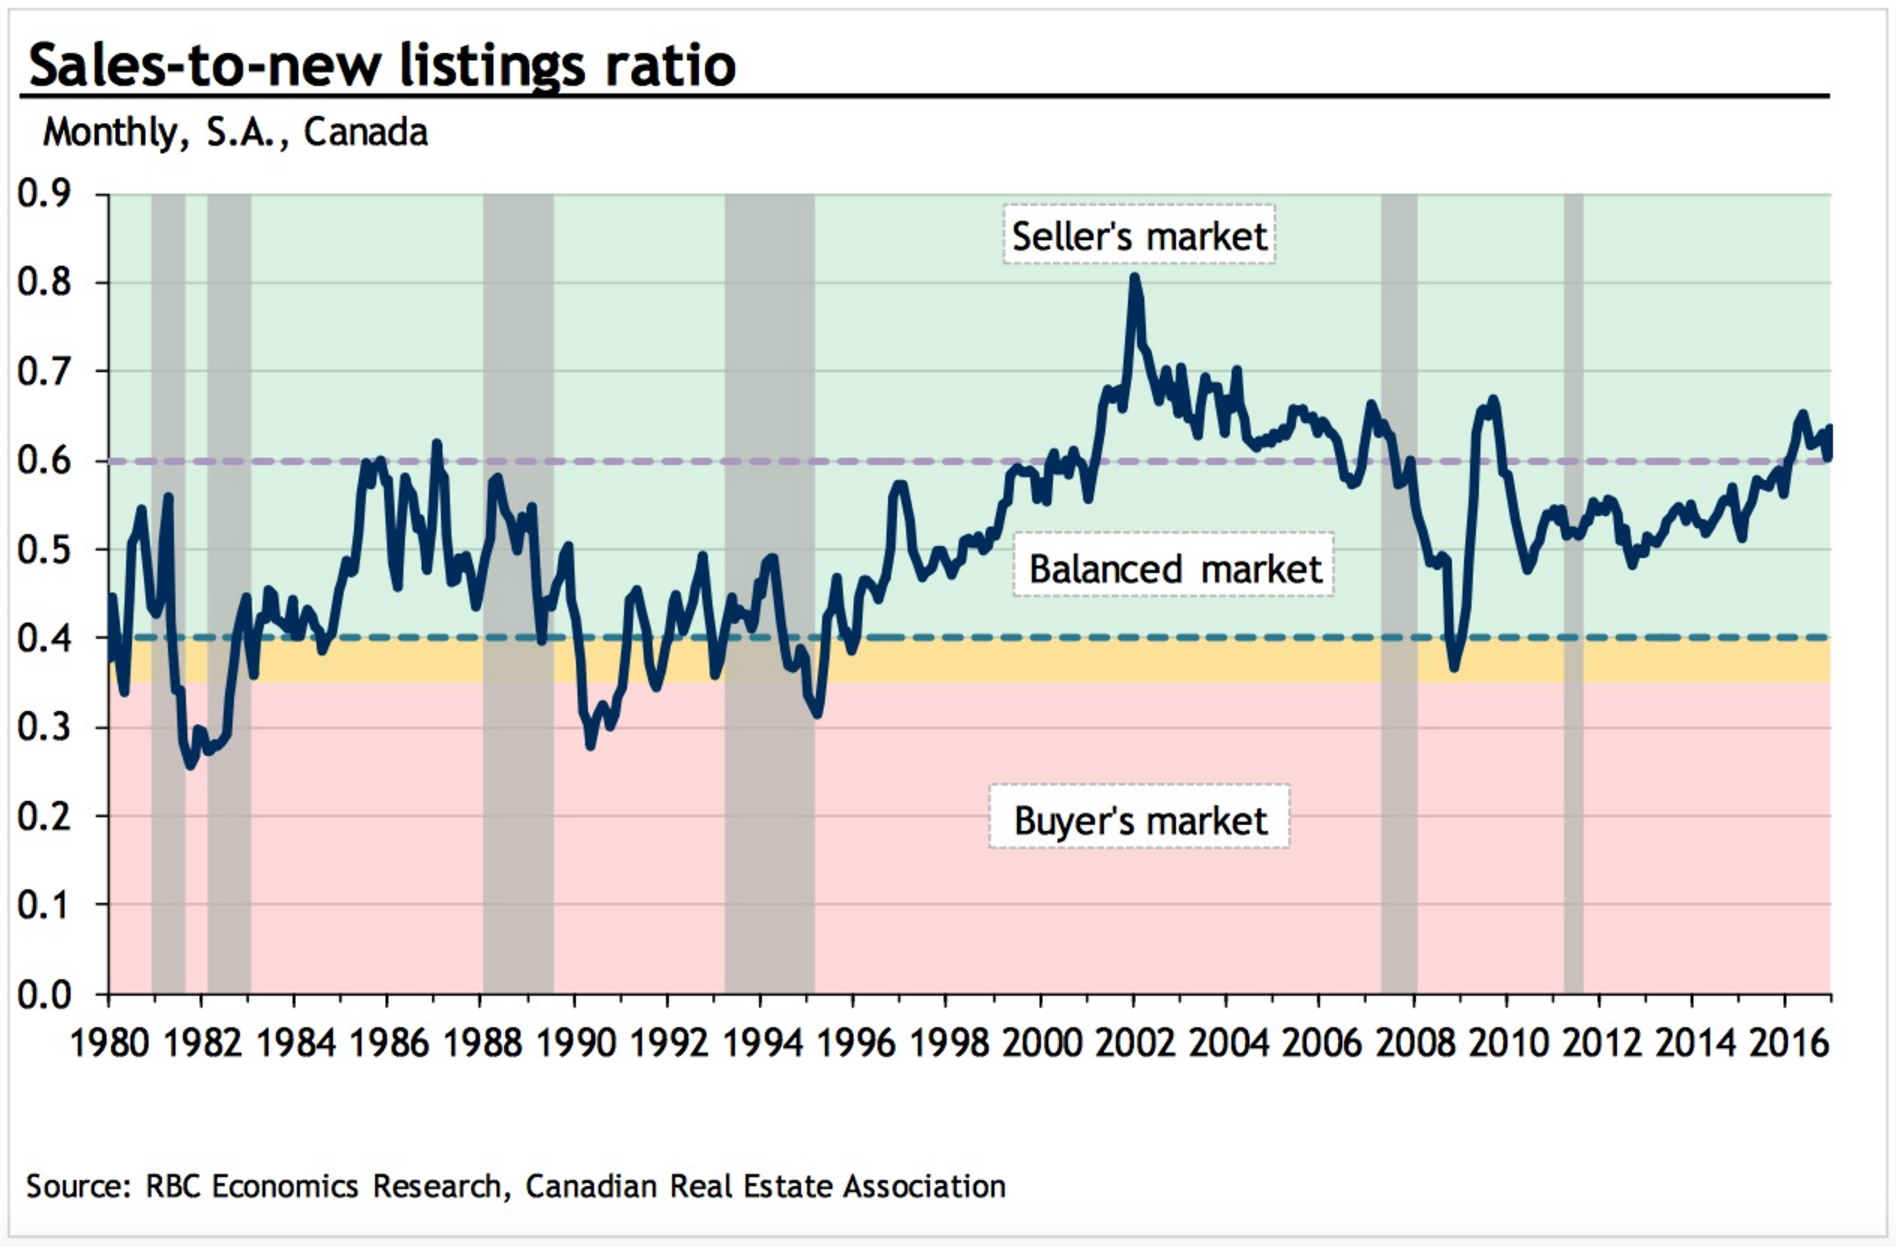
Whats going on here? The sales-to-new listings ratio for Canada. That's home sales divided by new listings in a month, expressed as a percentage. A ratio of 100% would suggest homes are selling at a rate as fast as new listings are appearing.
The takeaway: "When the ratio approaches, or is above 0.6 [percent], the market favours sellers and prices typically rise rapidly," write RBC economists Craig Wright and Robert Hogue. The nationwide ratio was 0.63% to close out 2016.
6. So this is why bidding wars break out over detached homes in Toronto...
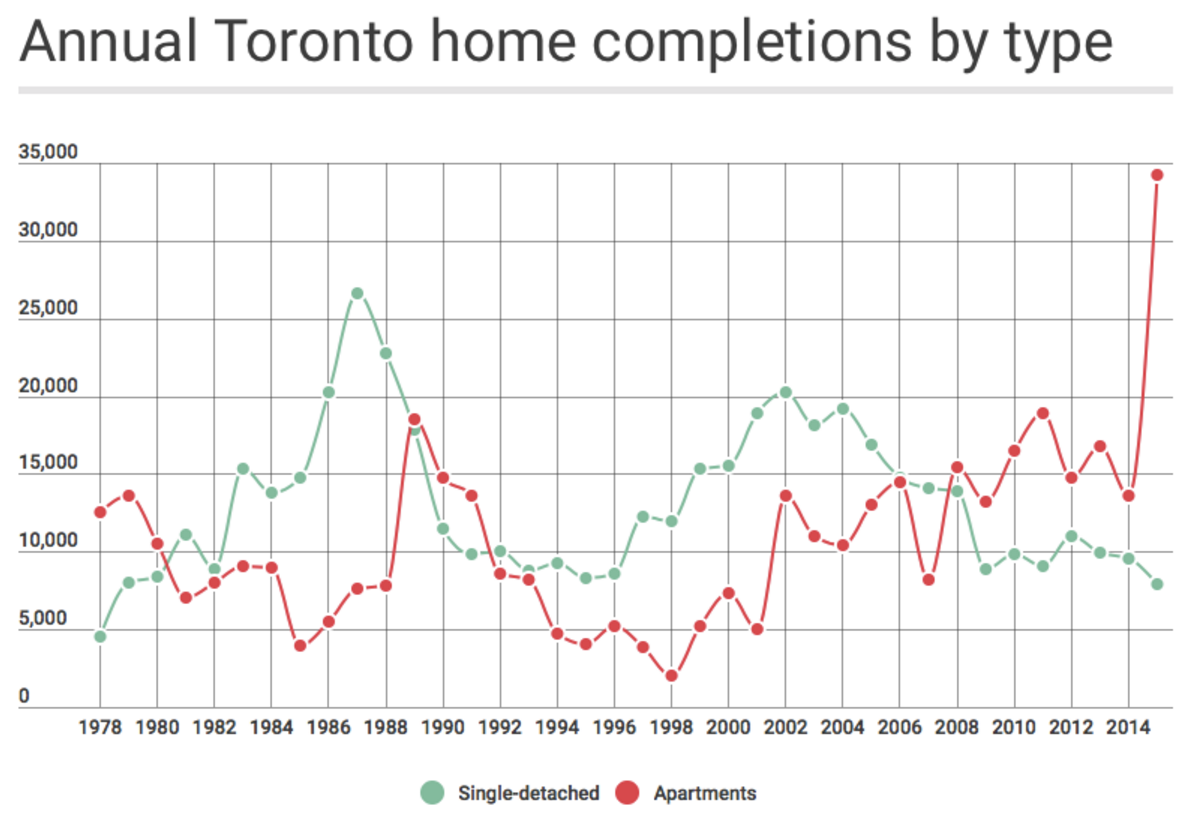
Whats going on here? Not much, so far as single-family home construction goes. There's been a sharp increase in the number of condos builders have been wrapping up in Toronto, but they haven't added much housing stock by way of desirable detached homes.
The takeaway: "The big story remains below the surface, where single-detached completions hit the lowest level in 36 years in 2015 - and that's before adjusting for population size," explains BMO Senior Economist Robert Kavcic. "Cue the bidding wars," he adds.
7. The "spillover" effect
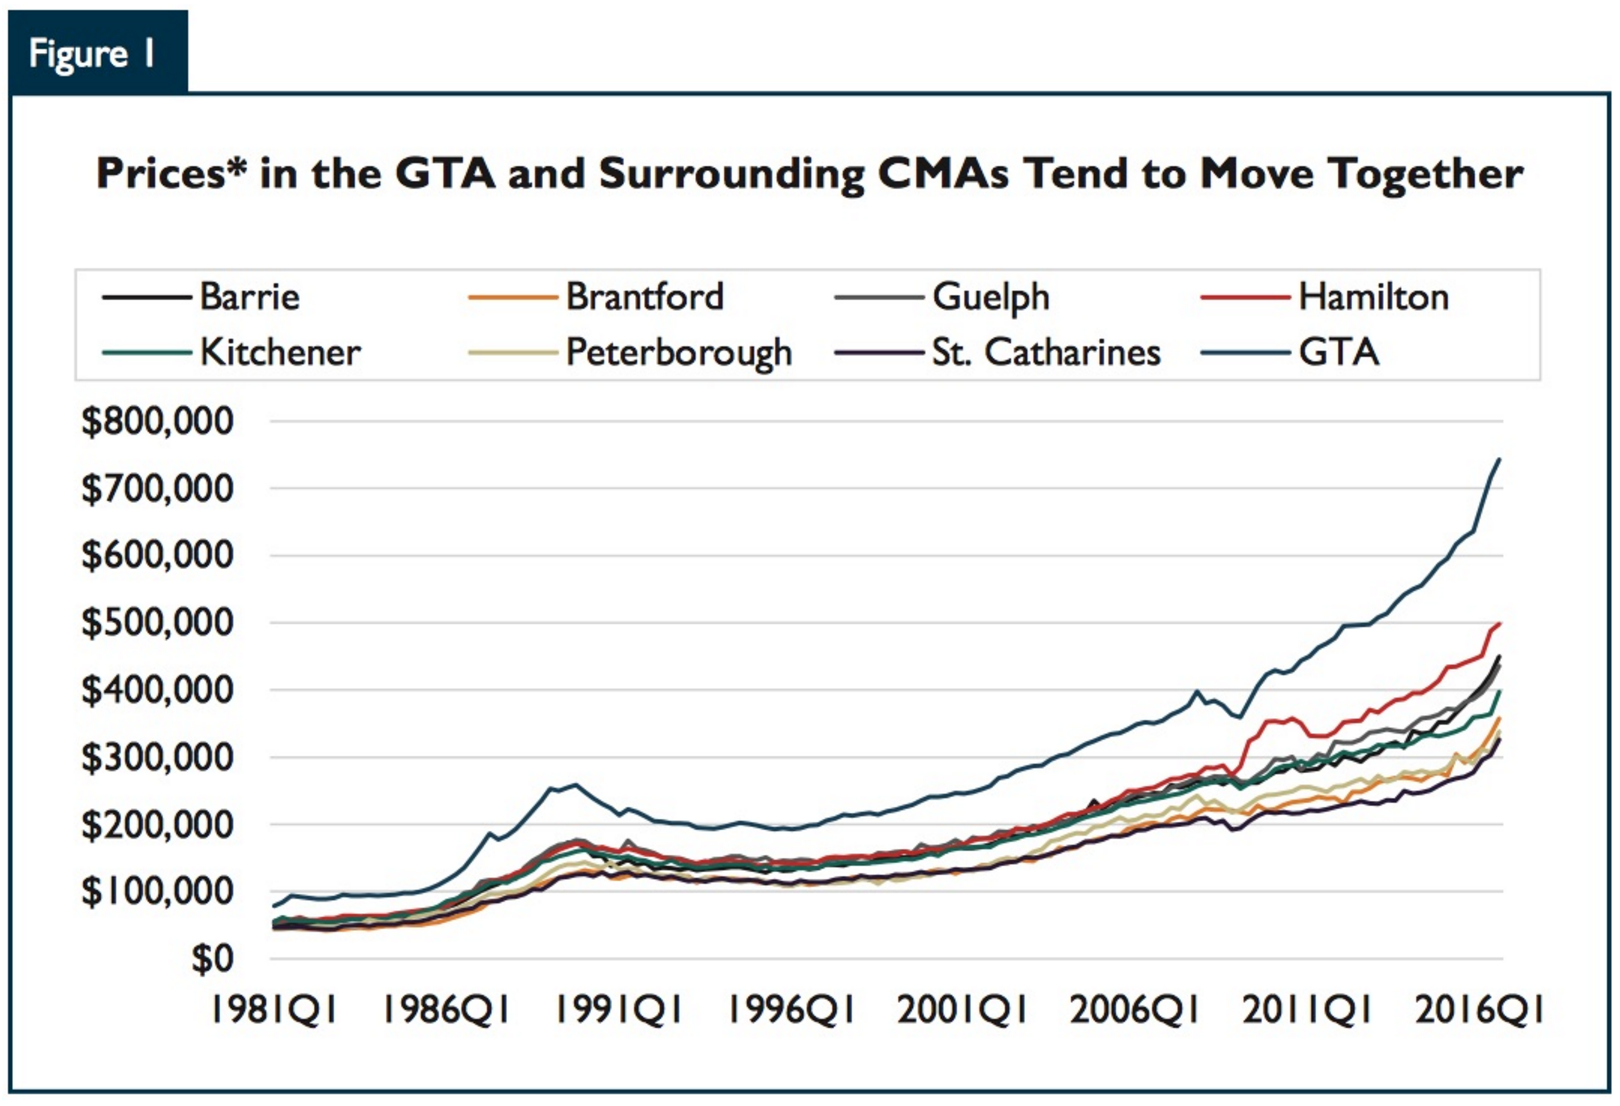
Whats going on here? Canada Mortgage and Housing Corporation traces home prices in the GTA as well as satellite markets including Guelph and Hamilton.
The takeaway: When home prices go up in a major Canadian city, nearby real estate markets feel the heat. "Our evidence indicates that increasing single-family home prices in the GTA are motivating buyers to purchase more affordable homes in nearby centres," says Jean Sebastien Michel, CMHC's principal of market analysis.
8. Canadian debt isn't to blame
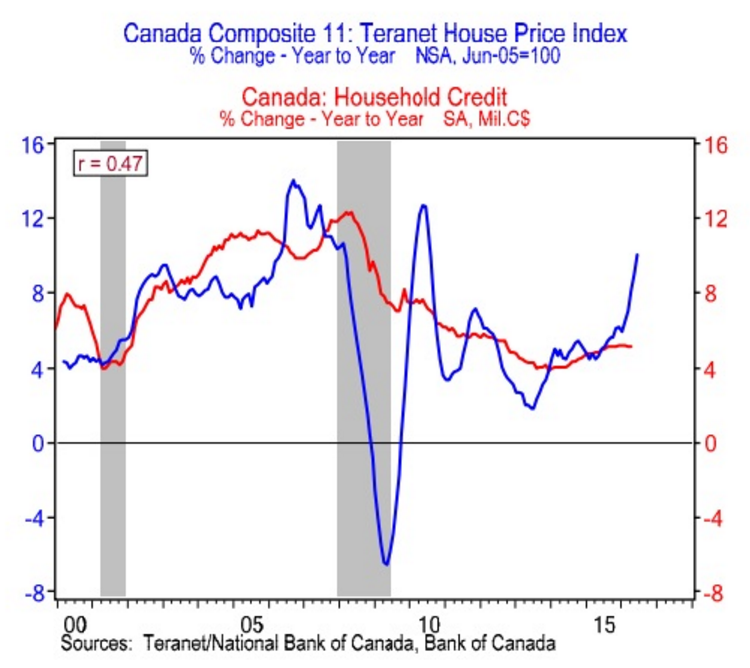
Whats going on here? Canadian home prices (blue) have soared at a time when household debt (red) has not, breaking from historical norms that see the two generally track closely in line with each other.
The takeaway: "Something besides domestic borrowing has clearly fanned the flames," notes BMO's Porter. "We will simply note the anecdotal evidence that many foreign buyers do not borrow to buy."
9. How long would it take for Canada's resale housing supply to reach zero?
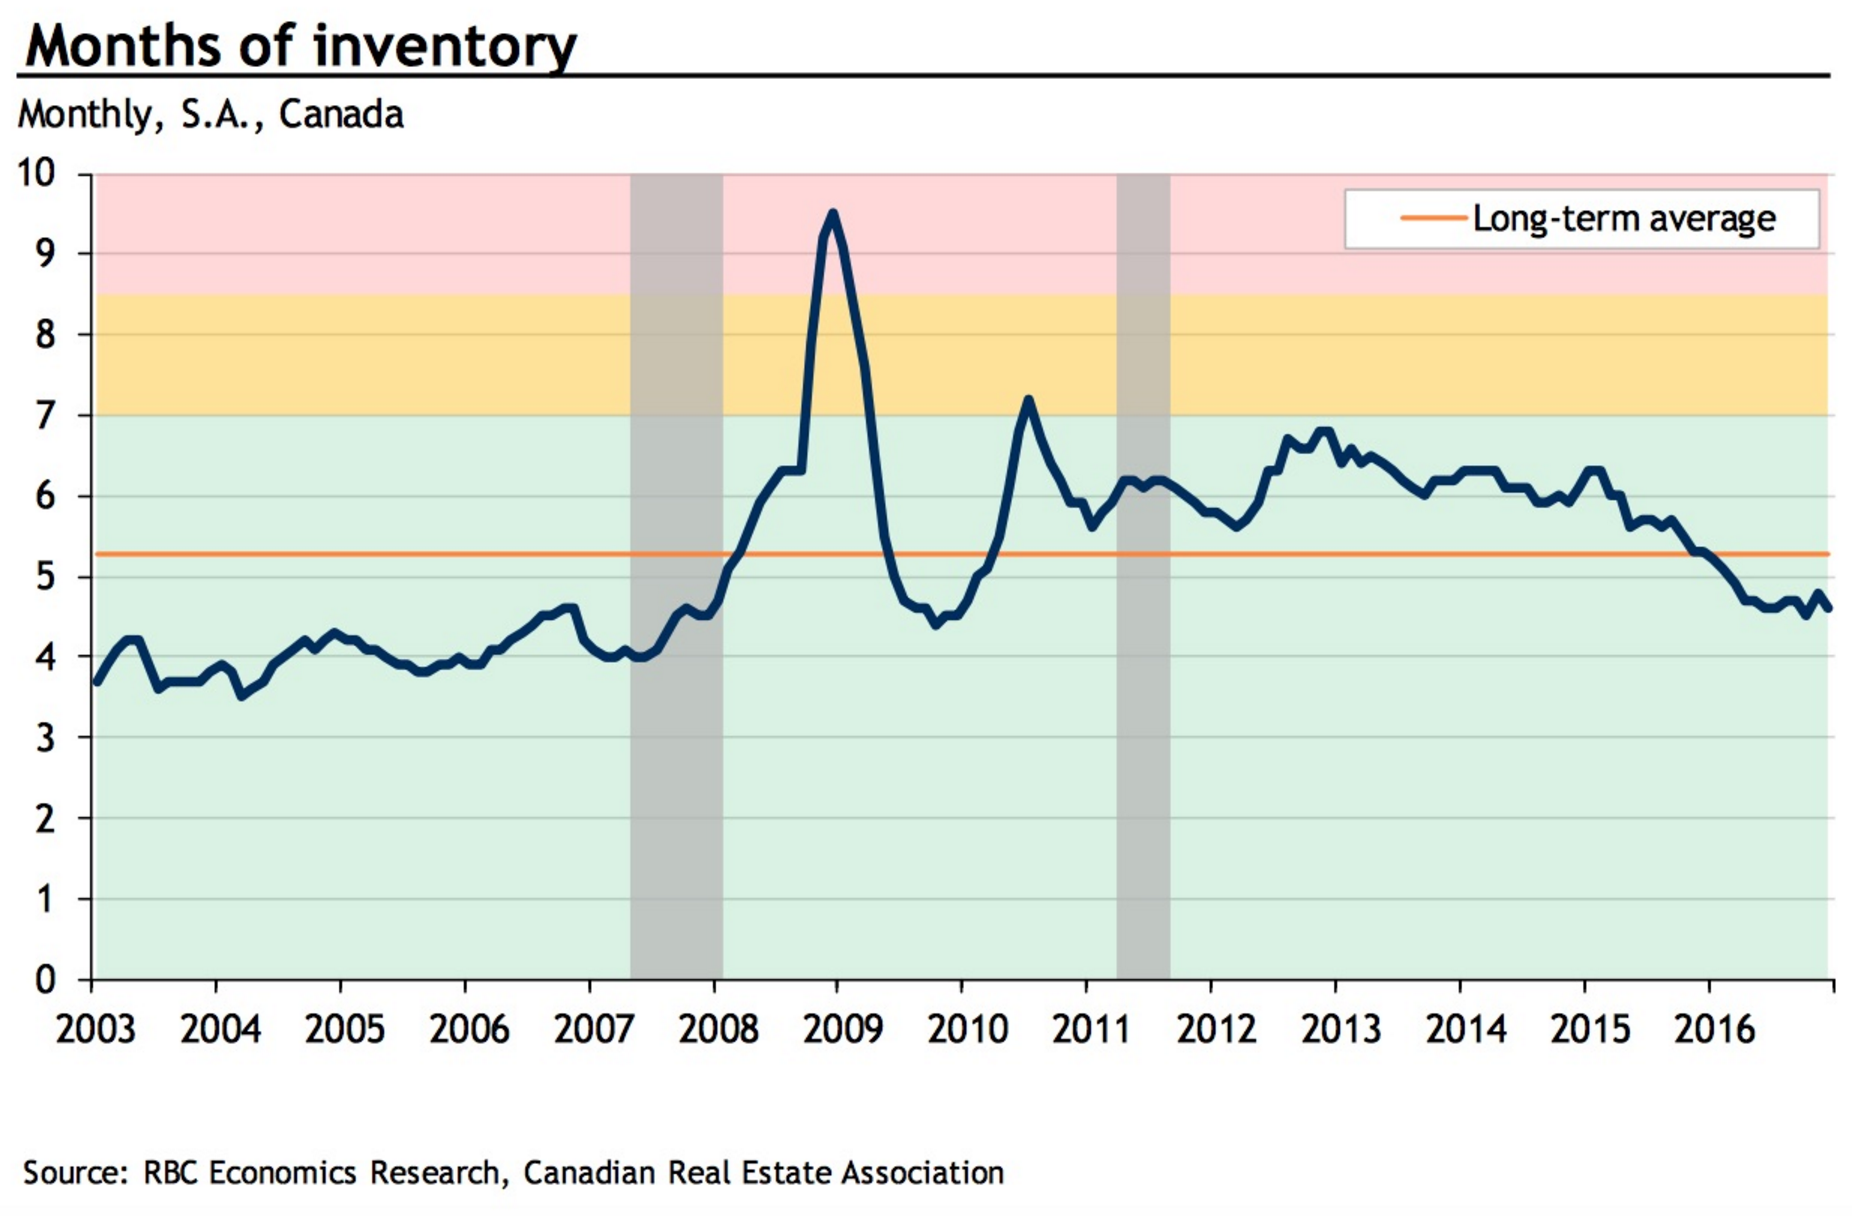
Whats going on here? RBC expresses the number of homes on the market across Canada in terms of how quickly they would sell out at the current pace of sales - supposing no new listings appeared.
The takeaway: "The slowdown in listings amid still-strong (albeit easing) resales reduced the number of months' inventory in Canada to the lowest level (4.5) in more than six years in the early-fall before rising marginally to end 2016 at 4.6," say RBC economists Craig Wright and Robert Hogue.
Post a comment