
Hot Real Estate Markets Driving Canadian Household Wealth
Tuesday Sep 22nd, 2015
HOT REAL ESTATE MARKETS
Driving Canadian Household Wealth

Canadians grew wealthier in 2014 as they saved more money while slowing their pace of borrowing, leaving many households better prepared to weather falling oil prices and recent economic downturns.
Household debts climbed 2.9% on average last year while assets grew 5.5%, pushing average household net wealth to $589,511 in Canada, according to the latest WealthScapes analysis by Environics Analytics.
The latest report shows real estate remains the largest component of household wealth, worth an average of $354,044 per household and accounting for 49% of total assets. Peter Miron, senior research associate at Environics Analytics, said real estate was "not too bubbly" last year, with values climbing by 5% on average, while other household asset categories such as investments were also significant drivers of wealth increase.
Investments, for example, climbed 7.8% per household last year as stock markets rose, while Canadians also saw liquid savings deposits grow 1.4%. The value of workplace pension plans grew 7.2% per household.
Mr. Miron said many people have become "fixated" on concerns about high household debts, but the borrowing is more than offset by the balanced asset growth. "Canadian balance sheets are in very good shape - even better than prior to the financial crisis," Mr. Miron said.
National averages, however, mask uneven growth in wealth across the country.
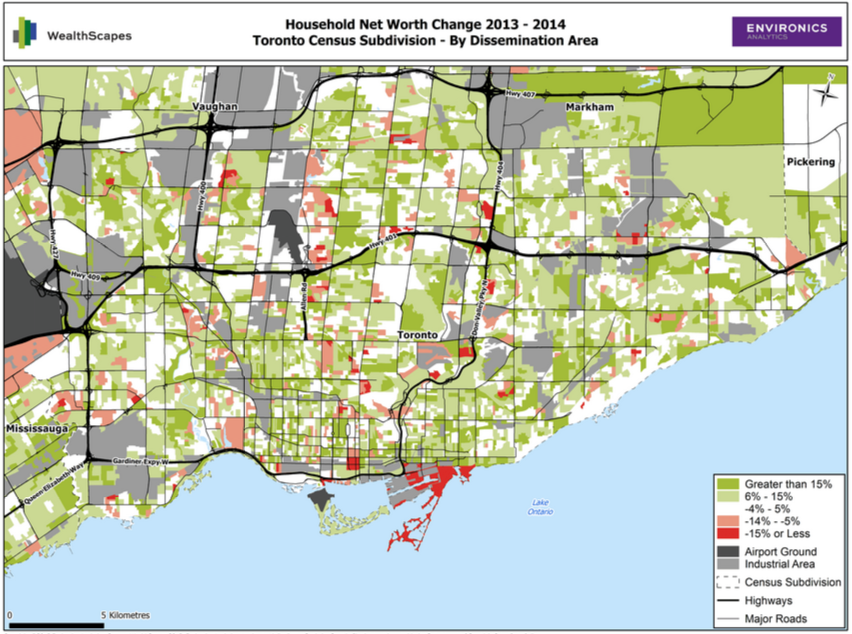
In British Columbia, Alberta and Ontario, for example, assets grew by far more than the national average due to hot housing markets. Vancouver remains Canada's wealthiest city with an average household net worth of $867,817, followed by Calgary at $835,823 and Toronto at $826,883. Montreal households, however, had the lowest net worth amount Canada's 10 largest cities, with the average net worth of $459,231. Mr. Miron said the comparatively lower wealth is due in part to "relatively stagnant" real estate values.
Savings rates also varied widely across Canada.
Households in Vancouver, for example, saw liquid savings - mostly in bank accounts - increase by $12,492 on average last year as many people hoarded cash to afford down payments on homes. In Montreal, however, residents reduced their liquid savings by $9,721 per household, while Calgary households cut liquid savings by $8,858.
Mr. Miron said the data for Calgary likely did not reflect much of the recent downturn in oil prices and resulting job losses, because the pain began late in 2014 and there is usually a lag before households feel a strong impact from changing economic conditions.
Similarly, he said it will take time for any impact of the contraction of Canada's economy in the first two quarters of 2015 to affect household wealth, even if it turns out to be a longer downturn.
"It hits companies first and then it hits households," he said. "And even once it hits households, it takes a little while for it to hit household balance sheets. Households can usually stomach a small economic blip, but as it goes on further, they have to start making tough choices." He said the WealthScapes data for 2015, which will be reported next year, may show far more effect on Alberta and other resource-dependent provinces.
Mr. Miron said a reduction in household liquid savings can be a negative sign of financial distress, or can signal confidence if some people feel optimistic enough about their financial situation to forge ahead with large discretionary purchases. Money has "poured into" savings accounts since 2008, he said, and some people are now spending it.
The wealthiest 20% of Canadians decreased their liquid savings by an average of $16,638 per household last year, while likely indicates many made large purchases, Mr. Miron said.
At the other end of the spectrum, the 20% of households with the lowest net worth saw their liquid savings climb by $3,307 last year and their net worth increase by 9.3% overall. The result is the gap between Canada's richest 20% and poorest 20% shrank slightly last year.
Mr. Miron said it is a good sign when the poorest households boost their savings significantly because many people at those income levels live paycheque to paycheque.
"The fact they're saving liquid assets suggest they did have a good year, and that they do have money left over to actually do those savings," he said. "It suggests there is a bit more of an unexpected windfall in that group." The WealthScapes model, which uses 178 financial and investment statistics to measure wealth changes, was expanded this year to also include the value of workplace pension plans, providing a broader picture of household wealth in Canada.
The new data show pension plans are a "great leveller" with pensions contributing a relatively similar amount toward household wealth in most cities across the country. The exceptions, however, are Ottawa and Quebec City, where pensions are far more prevalent than average due to large government work forces.
Post a comment