

THESE TORONTO NEIGHBOURHOODS ARE SEEING A HUGE SPIKE IN DOLLAR VALUE
Sarah Niedoba, BuzzBuzzHome

Image courtesty of: Dan Cooper / Toronto Star
The Toronto housing market looked quite different this time last year, as activity reached record heights and pundits warned of bubble-like conditions. Last month, home sales and prices dropped 31.1% and 12.4% year-over-year respectively, falling sharply from the record-hitting levels report last April.
But according to a new report from Zoocasa, sales numbers and average sale prices aren't always the best tools to measure what's been happening in the housing market.
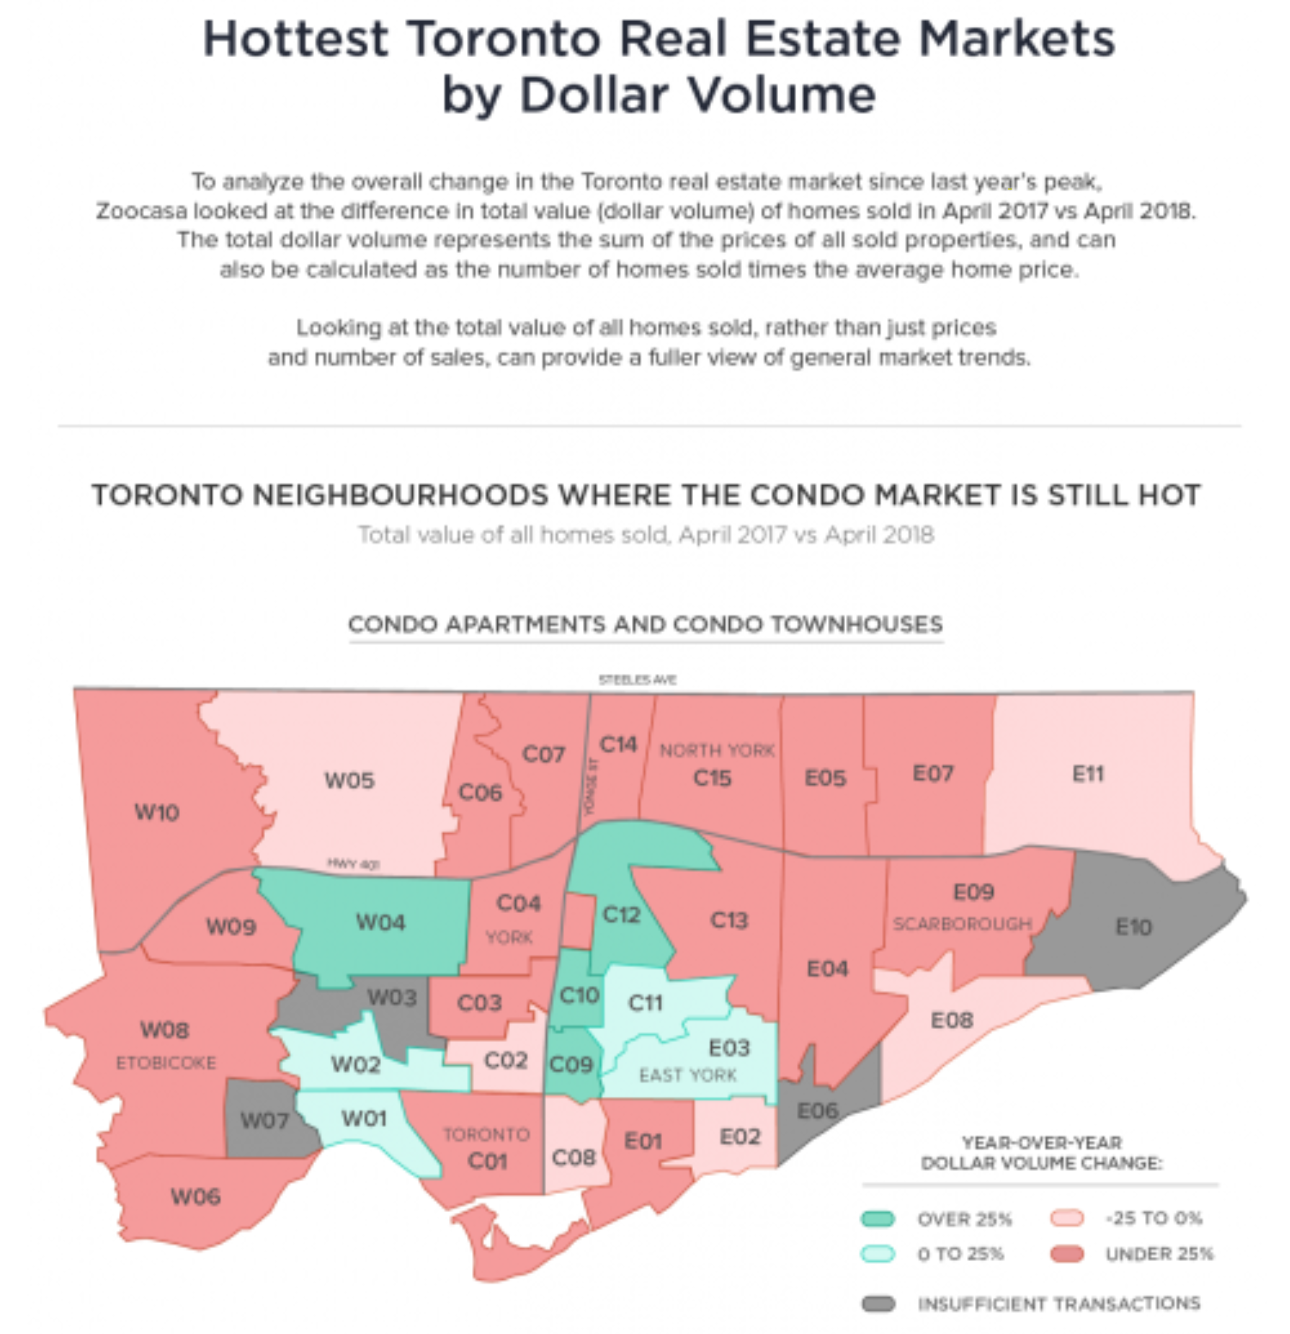
"While the number of sales...and average sale price are commonly used metrics to measure housing activity, they don't tell the whole story regarding the total value of homes sold," reads the report. "Rather, this is calculated by determining dollar volume, which represents the sum of the prices on all properties sold."
According to Zoocasa, tracking dollar volume can offer important insight into the activity and desirability of a particular neighbourhood.
The report tracked how dollar volume has shifted throughout the City of Toronto from April 2017 to April 2018, and found that condo dollar volume had skyrocketed in four neighbourhoods: Rosedale-Moore Park, Mount Pleasant East, Bridle Path/Hoggs Hollow/St. Andrew-Windfields and Yorkdale-Glen Park/Weston. Each neighbourhood saw condo volume jump over 25% in the past 12 months.
"These four regions topped the list as sales either increased significantly or saw sales at a higher price point, increasing the overall dollar volume," Zoocasa spokesperson Mr. Bernhardt tells BuzzBuzzNews. "[These] are all centrally located districts with a greater proportion of luxury units. Condo buildings in Yorkdale-Glen Park/Weston are usually older, with larger units - and the value they present was obviously attractive to buyers, who increased the dollar volume."
For a closer look into which neighbourhoods saw a jump in dollar volume from April 2017 to now, take a look at the infographic below.
Post a comment